Assessing a killer volcano
Mt Merapi is one of the most active and dangerous volcanoes on Earth. Table 2 provides a summary of the extent of the volcanic hazards in the Mt Merapi area and their occurrence. A potential hazardous volcanic event (e.g. lahar) is expected to occur every 2-4 years, and over greater time intervals the potential hazards become increasingly more threatening. The extents of these deposits are also described in the "deposits" section.
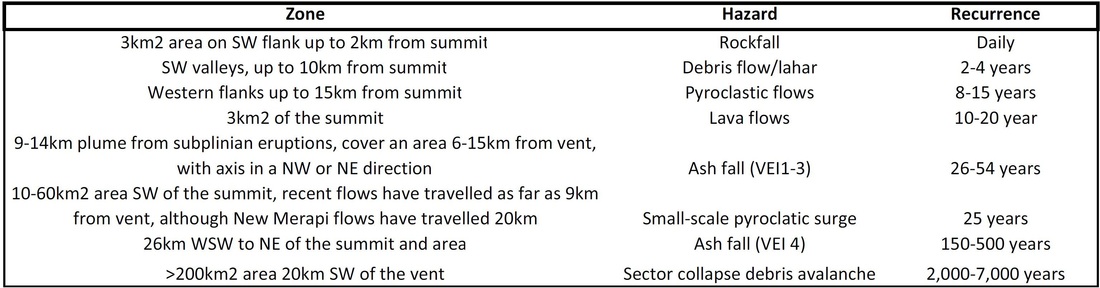
Table 2: Summary of hazardous area around Merapi and the recurrence interval for each hazard.
Hazard mapping
The earliest hazard maps of Mt Merapi (e.g. Pardyanto et al., 1978; Thouret et al., 2000) focused largely on the immediate pyroclastic flow and lahar threats. Pardyanto et al. (1978) created three hazardous areas, termed the forbidden zone, first danger zone, and second danger zone, which more less were a function of the distance you are from the vent in the SW quadrant. Thouret et al. (2000) revised this classification taking into account the styles of activity that occur over different timescales. Consequently, he designed 3 hazard maps, that correspond to (1) lahars and debris avalanches, (2) VEI 2-3 eruptions, and (3) VEI 4 eruptions.
Taking into account all these maps, and new ash fall data from Gertisser et al. (2012), I have create a single hazard map that considers hazardous areas over less than 100 year and 100-1000 year timescales. One advantage to this map is that it takes into account the documented change in the trajectory of ash between VEI 1-3 and VEI 4 eruptions (explained in "deposits" section). It also provides a broad view of all hazards in a single map. The disadvantage of this map when compared, for instance, to the Thouret et al. (2000) maps, is that it does not account for the complexity of volcanic events occurring on less than 10 year timescales.
Taking into account all these maps, and new ash fall data from Gertisser et al. (2012), I have create a single hazard map that considers hazardous areas over less than 100 year and 100-1000 year timescales. One advantage to this map is that it takes into account the documented change in the trajectory of ash between VEI 1-3 and VEI 4 eruptions (explained in "deposits" section). It also provides a broad view of all hazards in a single map. The disadvantage of this map when compared, for instance, to the Thouret et al. (2000) maps, is that it does not account for the complexity of volcanic events occurring on less than 10 year timescales.
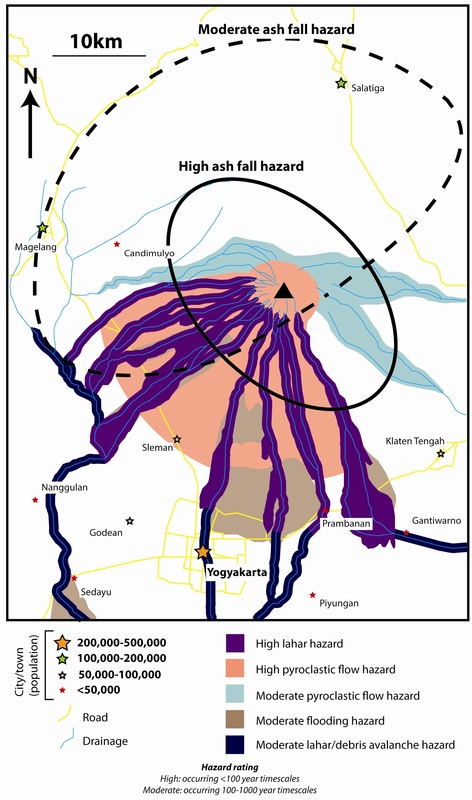
Figure 28: Hazard map of the Mt Merapi area.
Hazard exposure

Table 3: Summary of the estimated population exposed to Merapi hazards.
Table 3 provides a summary of the estimated number of people exposed to the various hazards outlined in Figure 28. Note that detailed population statistics in the area are hard to come by, and that these numbers are only estimates based on the population of the regencies and the extent to which each hazard covers these regencies.
Table 3 provides a summary of the estimated number of people exposed to the various hazards outlined in Figure 28. Note that detailed population statistics in the area are hard to come by, and that these numbers are only estimates based on the population of the regencies and the extent to which each hazard covers these regencies.
Risk to local populace

Table 4: Estimates of the risk (i.e. total cost) to the local population and economy in the event large and small eruptions at Merapi.
The risks associated with any volcano depends on the frequency and size of volcanic hazards, the perceived value of human life and infrastructure, and the vulnerability of the population and its' capacity to recover from, and mitigate, the particular hazard. Table 4 provides a simple approach to roughly estimate the risk to the local populace (primarily those in the Sleman Regency and Yogyakarta metro district). The risk is considered in terms of cost per year and the figures are primarily based on data from the 2010 eruption (cf. Sumaryono, 2011). Judging by recent history, Merapi volcano produces a devastating VEI 3-4 eruption every 50-100 years, whereas less costly, but more frequent, VEI 1-2 eruptions occur every 8-15 years. The VEI 4, 2010 eruption resulted in 322 deaths and 350,000 people displaced. The eruption cost the region approximately 780 million USD, due to destruction of farms and infrastructure and the inability for those displaced to work. The number of deaths, people displaced, and the volume of the more common VEI 1-2 eruptions is typically an order of magnitude less than larger events, and thus the cost of these events is considered here to be approximately one tenth that of the 2010 event. With these considerations in mind, I calculate that the risks associated with Mt Merapi eruptions cost the local populace approximately 17 million USD a year.
Reducing risk at Merapi
Lahar risk reduction
Lahars are a constant threat to the people of the Slemency regency, with more than 490 lahars occurring since 1900AD, at a rate of more than 4 a year (refer to Table 1). Lahars at Merapi will often travel farther than pyroclastic flows (Figure 28). For instance, the 2010 eruption resulted in pyroclastic flows that traveled 15 km from source, whereas lahars reached distances of 25-30 km (Sumaryono, 2011). Lahars not only provide an immediate threat to people and infrastructure, but they can also increase the risk of floods and even flash floods. Although frequent, lahars will generally be confined to river valleys only a few 100 meters across, and can have their flow impeded by lahar dams, or more specifically sabo dams (Figures 29 and 30). Since 1970, about 200 sabo dams have constructed in rivers around Merapi (Figure 31).
Although sabo dams have been shown to control sediment flow even when full, the most effective sabo dams are those that are empty (Sumaryono, 2009). Consequently, organized, year-round sediment excavation of all of Merapi's sabo dams will ensure that all the dams work at maximum capacity. When viewed from Google Earth, it is clear that many, if not most, of the sabo dams at Merapi are full (Figure 30; also cf. video 4). The cost for excavating sediment can be offset by the expected profits from selling the sediment for construction. A truck load (~3-4 cubic meters) of sediment is worth 300-430 USD (Sumaryono, 2011). Currently, entrepreneurial companies are excavating sediment all along Merapi's rivers, but there is no concerted effort focusing solely on sabo dam excavations.
Additionally, new installations of slit sabo dams rather closed sabo dams will increase the networks capacity to reduce debris more effectively (Sumaryono, 2009).
Covering new deposited volcanic sediments in vegetation is an inexpensive way to prevent sediment remobilizing into lahars. The fertile volcanic sediments will help grow the planted vegetation quickly. Recent pyroclastic flow deposits in the Gendol river valley would be an ideal target for plantations.
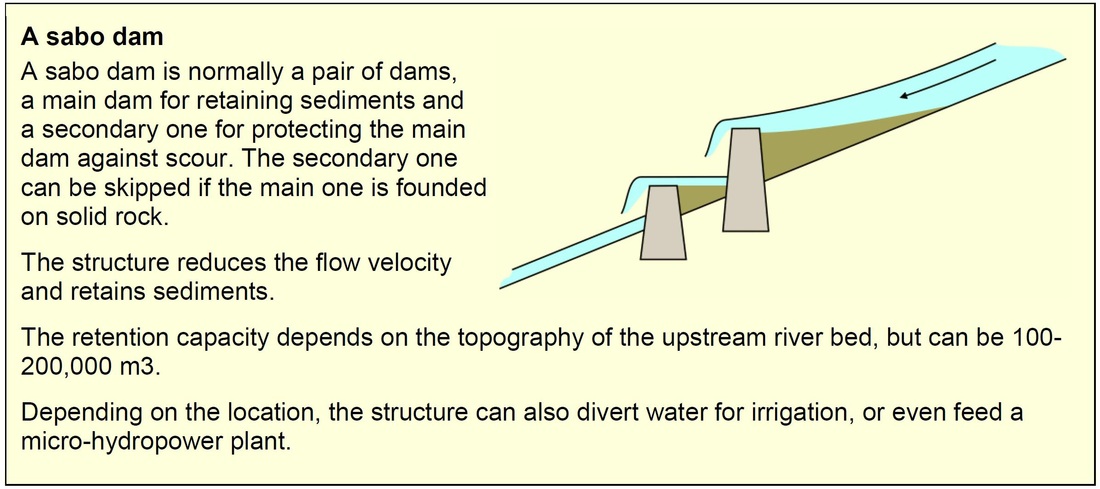
Figure 29: Illustration and description of a sabo dam from Sumaryono (2011).
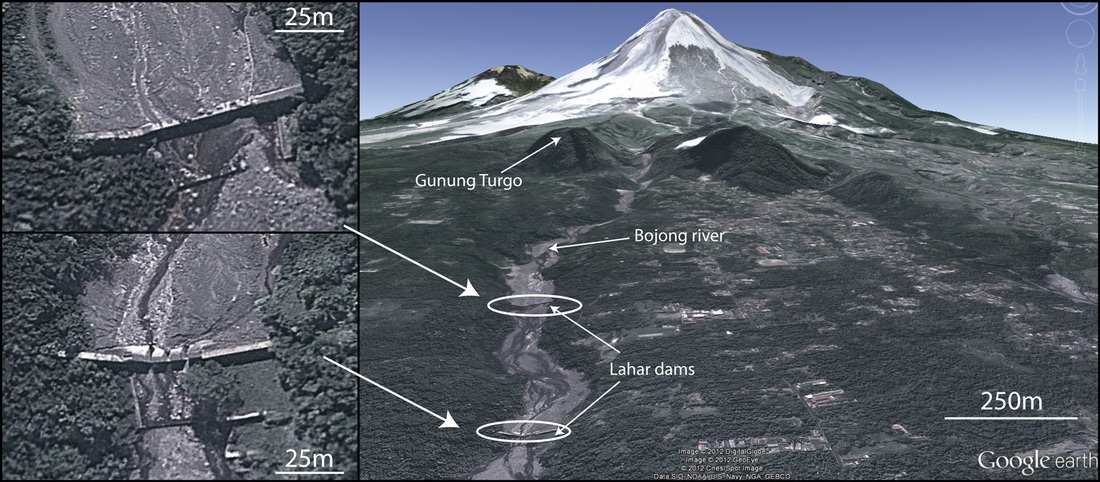
Figure 30: Two Lahar dams located 7.5 and 8.0 km from Merapi's summit. Note that each dam was full when the image was taken.
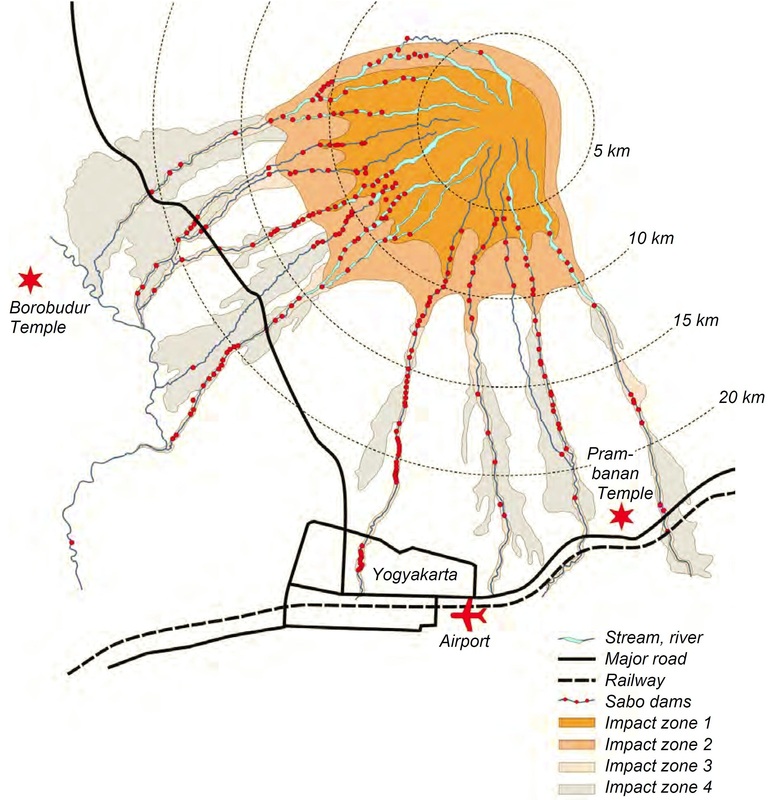
Figure 31: Distribution of sabo dams around Merapi, from Sumaryono (2011).
Ash fall hazard risk reduction
Compared to pyroclastic flow and lahar hazards, ash fall hazards have resulted in fewer casualties at Merapi. However, given the the broad area covered by the high and moderate ash fall hazard zones it important that the risks associated with ash fall are reduced. Roof failure from heavy loads of water saturated ash is the number one contributor to ash fall related fatalities (Spencer et al. 2005). Spence et al. (1996) suggest that buildings capable of sustaining loads of 2.0 kN/m2 during the 1991 Mt Pinatubo eruption were not severely affected by ash fall; ensuring that buildings in the high and moderate ash fall hazard zones can sustain these loads will reduce the risks associated with ash fall hazards at Merapi.
Volcano monitoring as a tool for risk reduction
Table 6 summarizes the "threat score" for Mt Merapi based on USGS-designed schematics (Ewert, 2007). Considering that a volcano scoring between 64 and 267 requires the highest level of monitoring, a score of 379 for Mt Merapi is startling, and surely demonstrates that Merapi is one of the most dangerous volcanoes on Earth.
The level of monitoring at Mt Merapi is too low given this very high threat score, and Table 5 provides a list of the monitoring improvements required at Mt Merapi. Given that early warning is the best preventative of fatalities during events such as pyroclastic flows, these improvements will greatly reduce the risks posed by these hazards. Finally, Mt Merapi is also considered a high aviation hazard, and is located within the flight path of airliners flying daily from the Asia/Europe region to Asia/Oceania. It is not only in Indonesia's best interest to make these improvements, but it is also in the best interest of countries around the world to minimize the cost associated with volcanic emissions from Merapi by improving monitoring infrastructure in the region.
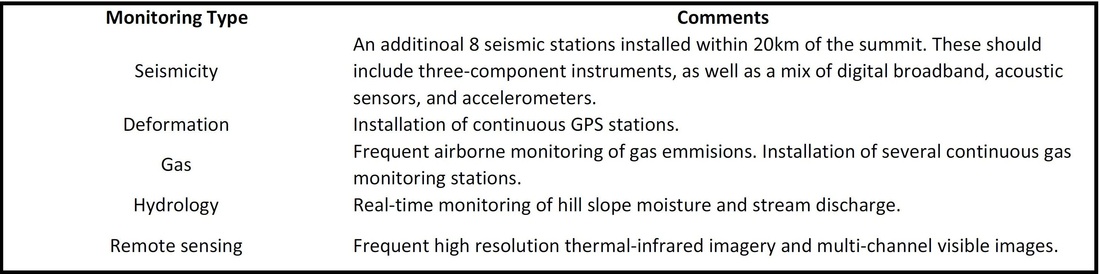
Table 5: List of monitoring improvements required at Mt Merapi, based USGS-designed schematics from Ewert (2007).
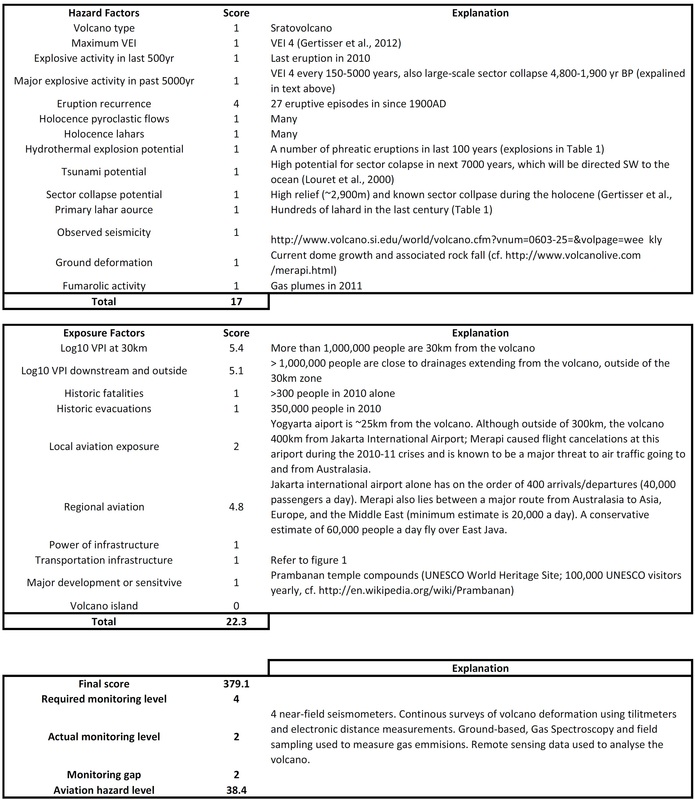
Table 6: Summary of Mt Merapi's volcano threat, based USGS-designed schematics from Ewert (2007).
